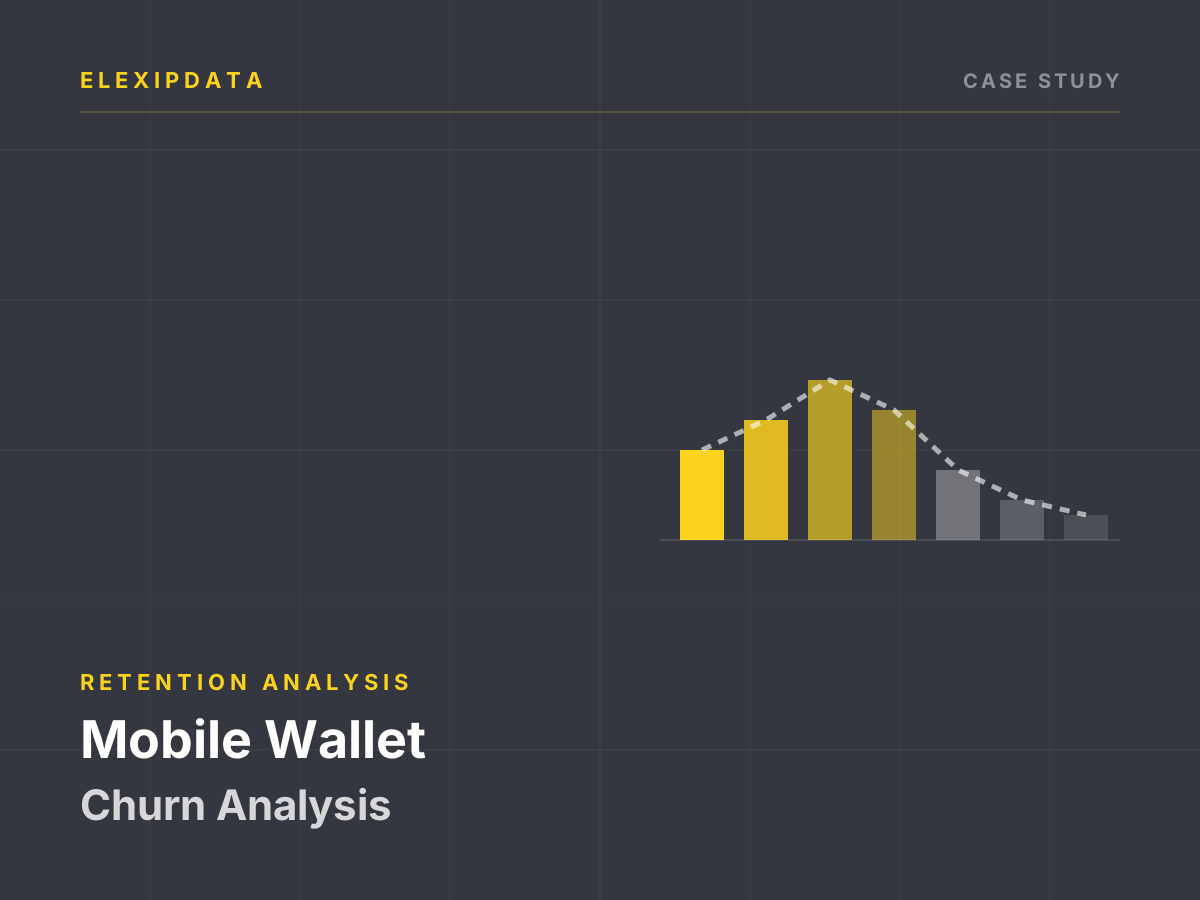
A prepaid wallet business loses subscribers quietly. There is no contract to cancel and no final bill; usage simply declines until the account becomes inactive. By the time a customer is visibly gone, the cheapest retention moment has passed. The business wanted a churn score to decide who should receive a recharge incentive, a reminder or a call — and, just as importantly, who should not.
The decision
The retention team could contact only a small share of the base each month. The score therefore had to rank subscribers by the value at risk, not just by the probability of leaving. It also had to be built from behaviour the business could influence: recharge frequency, balance, loan activity and recency. A score that depended on information unavailable at the intervention point would be analytically interesting and operationally useless.
What we worked with
A subscriber-level extract of roughly 210,000 rows covering two months of daily snapshots:
- Subscriber context: account age and a subscriber identifier.
- Balance and usage: daily debits over 30 and 90 days, rentals and recharge amounts.
- Recharge behaviour: counts, frequency and amounts over 30 and 90 days, plus the last recharge date.
- Credit behaviour: loan counts, amounts and repayment indicators.
- Outcome: a binary churn label.
The traps we designed around
- The label was not self-documenting. The minority class — about 12.5% of rows — corresponded to much lower recharge and loan activity, which was consistent with churn but opposite to the convention the team expected. We confirmed the polarity against activity measures and the business definition before building anything. A model trained on an inverted label can look plausible and be completely wrong.
- Rows are snapshots, not subscribers. About 186,000 unique subscribers produce 210,000 rows; roughly 20,000 appear more than once across the two months. A random row split would place the same subscriber in training and validation, inflating performance. We split by subscriber and by time.
- Some subscribers change label. Hundreds of identifiers carry both classes across snapshots. That may reflect a genuine change in status, a redefinition between extracts or a labelling issue. It had to be resolved before choosing one row per subscriber.
- Windows overlap. The 30-day and 90-day features are not independent measurements; they describe overlapping periods. Feeding all of them into a model without care creates redundancy and makes importance rankings unstable.
- Late snapshots are not comparable. The final dates in the extract are uniformly one class, which suggests the label was assigned with a forward-looking window that was not fully observable at those dates. Those rows cannot support the same training or validation logic as earlier snapshots.
- Activity is not value. A high-frequency, low-balance subscriber and a low-frequency, high-value subscriber can have the same churn probability but very different economics. Ranking by probability alone would misallocate the retention budget.
How the score was built
- Resolve the label definition first. We wrote down what churn meant, which observation date defined it and which snapshots were usable. Rows with an unobservable outcome window were excluded.
- Choose one observation per subscriber. For each subscriber we selected a decision point and built features only from information available before it.
- Split by subscriber and time. Training and validation were separated so that no subscriber and no future period leaked into the evaluation.
- Reduce overlapping features deliberately. We kept a small set of interpretable recharge and balance measures, tested alternative windows and documented the redundancy rather than letting the model choose arbitrarily.
- Model probability and value separately. A churn model produced the probability; expected value combined that probability with a simple measure of subscriber value. The retention list was ranked by expected value at risk.
- Tie the output to actions. Each risk band mapped to a specific intervention and cost, with a control group so the effect of the intervention could be measured rather than assumed.
What this changes
- The retention list is ranked by value at risk. The team stops treating a high churn probability as automatically worth a costly intervention.
- Label and grain are part of the deliverable. The definition, observation date and subscriber-level split are documented, so the score can be reproduced.
- Overlapping windows are visible. Feature importance is presented with a warning about collinearity rather than as a causal ranking.
- Intervention effects are measured. A control group turns a retention campaign into an experiment instead of a report of correlation.
What you receive
- A churn definition and observation-date note.
- A subscriber-level modelling table with leakage checks.
- Probability, value and expected-value-at-risk scores.
- Risk bands mapped to intervention cost.
- A holdout and control-group design for measuring retention lift.
Where this applies
The method fits prepaid telecom, mobile wallets, neobanks and subscription businesses with behavioural snapshots. The minimum inputs are a stable subscriber identifier, a defined churn window, transaction or recharge history, and an intervention the business can actually deliver. The first deliverable is usually the label and grain note — not the model.
This is an illustrative case study using an anonymized public dataset; it does not report results from a specific client engagement. It reflects our standard method for behavioural churn modelling.