A retail chain planned staffing, stock and promotions from a spreadsheet forecast that was often last year's number plus a growth adjustment. It worked in ordinary weeks and failed around holidays, weather events and shifts in consumer confidence. Store managers had learned to override it, so the central plan and the local plan disagreed — and nobody could tell whose number was better.
The planning decision
The forecast did not exist to be accurate in the abstract. It existed to answer three weekly decisions: how many staff to schedule, how much stock to position, and whether a promotion should be pulled forward or held. Each of those decisions has a different tolerance for error, and holiday weeks carry far more consequence than an average week. A single point forecast, presented without uncertainty, invited the planners to treat every week as equally knowable.
What we worked with
Weekly store-level records contained:
- Demand: weekly sales by store.
- Calendar: week date and a holiday flag.
- External conditions: temperature, fuel price, consumer price index and unemployment rate.
The history was long enough to model seasonality, but not clean. Some stores had gaps, some had short histories, and a few had structural breaks that no amount of feature engineering would fix.
Why the spreadsheet failed
- Holidays are not ordinary weeks with a multiplier. Their timing moves, their size differs by store, and the weeks around them behave differently from the week itself.
- External conditions matter, but not equally everywhere. Fuel price affects a suburban store with a large catchment differently from a downtown store with foot traffic.
- A single number hides the risk. Planners were making staffing and stock decisions as if the forecast were certain, then absorbing the miss when it was not.
- Local overrides were invisible. Managers adjusted the plan without recording why, so the organisation could not learn whether the overrides were adding value or just adding noise.
How the forecast was built
- Profile every store before modelling it. Trend, seasonality, volatility and missing weeks were examined store by store. Stores with short or broken histories were grouped with comparable stores rather than given their own unreliable model.
- Set baselines that must be beaten. A seasonal naive forecast and a moving average established the bar. A model that cannot beat these simple rules does not deserve to be deployed.
- Engineer calendar and external features deliberately. Week-of-year, holiday proximity, lagged sales and rolling averages were combined with temperature, fuel price, CPI and unemployment. Holiday weeks were flagged explicitly rather than left for the algorithm to discover from too few examples.
- Validate forward in time. Random cross-validation lets the model see the future. We trained on earlier periods and tested on the most recent weeks, repeating across several cut-off dates to see whether performance was stable.
- Weight errors by business impact. Holiday weeks matter more to planning, so the primary metric was a holiday-weighted error measure rather than a plain average. A model that is good in quiet weeks and wrong at Christmas is not a good planning model.
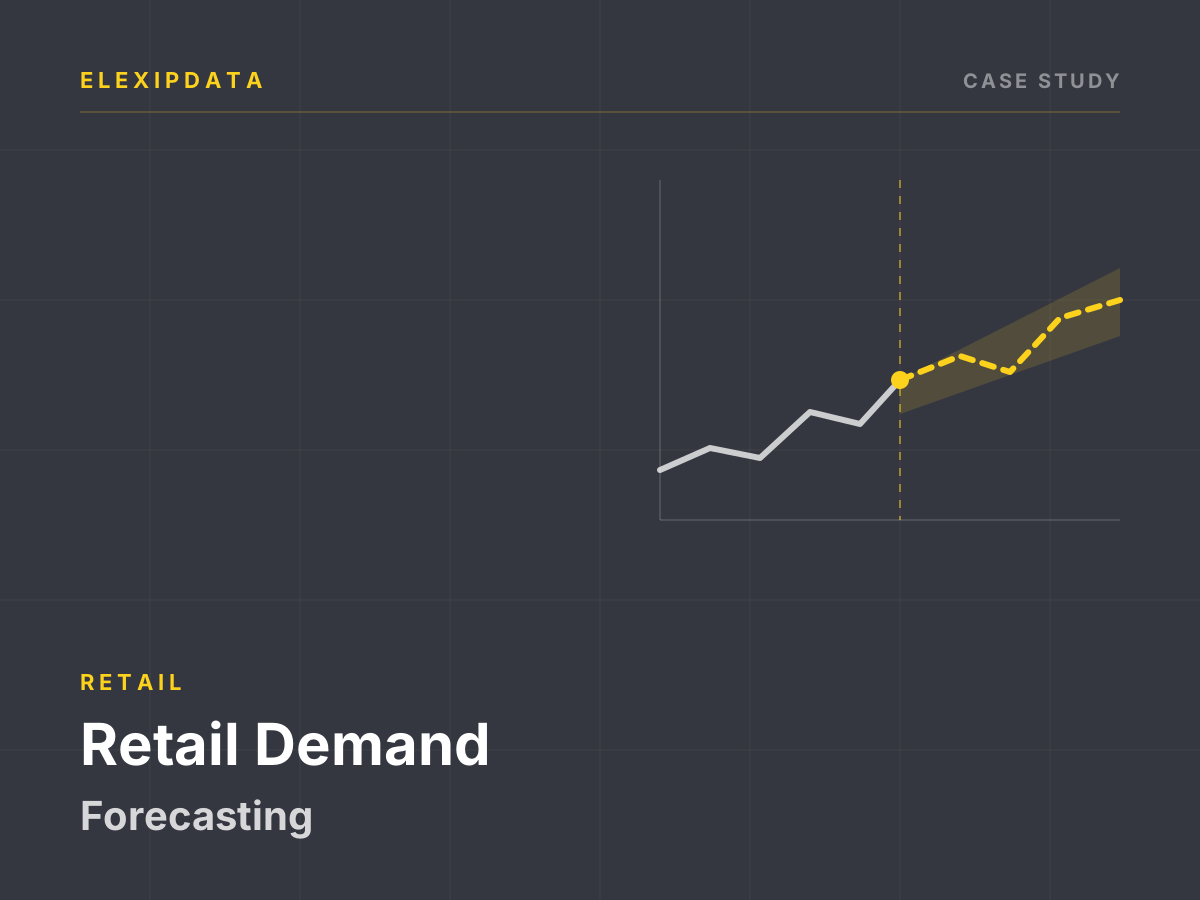
- Quantify the uncertainty. The output included a forecast range based on validation residuals. The range is what makes safety stock and staffing buffers a calculation rather than a guess.
- Segment by forecastability. The dashboard showed which stores were reliably forecastable and which needed manual review or a different planning cadence. Pretending every store is equally predictable is its own kind of error.
What this changes
- Central and store planning started from the same number. The forecast became a shared baseline instead of a document both sides quietly ignored.
- Holiday optimism became visible. The old spreadsheet was systematically optimistic in specific holiday weeks, which had been absorbed as a staffing problem rather than a forecast problem.
- Overrides became evidence. Local adjustments were recorded and compared with outcomes, so the organisation could distinguish a manager's genuine knowledge from a habit.
- Planning moved from a point to a range. Staffing and stock decisions could be tied to the forecast interval rather than to a single number with false precision.
What we delivered
- Weekly store-level forecasts with prediction intervals.
- A benchmark comparison against seasonal-naive and moving-average baselines.
- A store segmentation separating high- and low-forecastability groups.
- An accuracy dashboard with error trends and holiday performance.
- A retraining and monitoring schedule.
Where this applies
This fits retailers, distributors and service networks that plan weekly or monthly at location level. The minimum inputs are at least two years of history per location, a calendar with holidays, and whatever external indicators actually move demand in your category. The first deliverable is usually a baseline comparison and an error decomposition by week type — because most forecasting projects discover that the existing process is wrong in one specific, fixable place, not everywhere.
This is an illustrative case study built on an anonymized dataset; it does not report results from a specific client engagement. It reflects our standard method for retail demand forecasting.