Project Objective
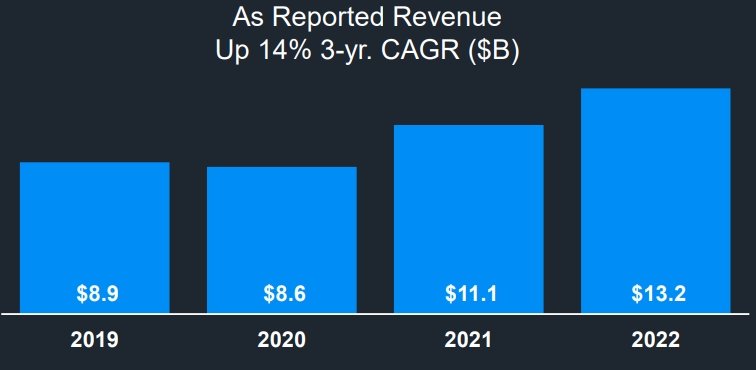
The primary objective is to conduct a comprehensive evaluation of a company’s financial health, performance, and operational efficiency. This involves analyzing historical data to identify trends and patterns, as well as making forecasts to inform future strategic decisions. The analysis aims to offer valuable insights for strategic planning, investment decisions, and overall financial management.
Data
Five years of data from various financial statements, including the Income Statement, Balance Sheet, Cash Flow Statement, Operational Drivers, and Non-GAAP Measures.
Analysis Methodologies
- Trend Analysis:
- Analyzing trends over the years for key financial metrics such as revenue, net income, expenses, assets, liabilities, and equity.
- Examining cash flow trends to understand operational efficiency, investment decisions, and financing activities.
- Ratio Analysis:
- Calculating and analyzing financial ratios such as liquidity ratios, profitability ratios, and solvency ratios.
- Providing insights into financial health, operational efficiency, and risk level.
- Operational Performance Evaluation:
- Assessing operational efficiency using metrics like sales per employee, inventory turnover, and days sales outstanding.
- Comparing metrics across years to track improvements.
- Cash Flow Analysis:
- Evaluating the quality of earnings by comparing net income to cash flow from operations.
- Analyzing investment activities and internal cash generation.
- Non-GAAP Measures Analysis:
- Analyzing Non-GAAP measures such as adjusted EBITDA, adjusted net income, and free cash flow.
- Understanding their significance and additional insights compared to standard GAAP measures.
- Comparative Analysis:
- Comparing financial performance and operational efficiency with industry benchmarks or peers.
- Forecasting and Valuation:
- Using historical data to forecast future performance.
- Performing valuation analysis using methods like discounted cash flow or peer comparison.
- Risk Assessment:
- Identifying potential risks based on financial data trends.
- Assessing the sustainability of dividends and stock repurchases.
- Narrative Building:
- Integrating quantitative analysis with qualitative information to create a comprehensive narrative about the company’s past performance and future prospects.
- Impact of External Factors:
- Considering macroeconomic factors, industry trends, and regulatory changes on future performance.
KPIs
Key performance indicators include revenue, net income, expenses, gross margin, net margin, profitability ratios, assets, return on assets, liabilities, equity, return on equity, debt to equity ratio, liquidity ratios, adjusted EBITDA, adjusted net income, and free cash flow.
Output
Visual reports and dashboards presenting findings in charts, graphs, and dashboards for stakeholders’ understanding and decision-making.
Insights
The financial analysis provides actionable insights for optimizing cash inflow and outflow, identifying areas of strength and weaknesses, and strategizing for operational improvements, investments, and financing activities. Comparative analysis with industry benchmarks reveals competitive positions and market opportunities.

